<font style="color:rgb(55, 53, 47);">1、回顾常见的 I/O 模型</font>
<font style="color:rgb(55, 53, 47);">在Redis 的多路复用解读中,有讲解到 五种常见的 I/O模型。</font>文章地址
<font style="color:rgb(55, 53, 47);">同步阻塞IO:用户线程 read后直接阻塞,让出cpu。内核等待网卡将数据拷贝到内核空间后,再把用户线程唤醒。</font>
<font style="color:rgb(55, 53, 47);">同步非阻塞IO:用户线程 不断的 read,数据没到内核,就返回失败。到了内核空间后,这一次的read会将数据拷贝到用户空间,但是用户线程是阻塞的,拷贝完成后,会将线程唤醒。</font>
<font style="color:rgb(55, 53, 47);">IO的多路复用:用户线程的读取操作分为两步,第一步进行 selcet 调用,目的是询问内核中的数据是否准备好了,线程不阻塞。当准备好以后,用户线程发起 read 调用,拷贝数据到用户空间这个过程中,线程是阻塞的。</font>
<font style="color:rgb(55, 53, 47);">多路复用体现在复用一个线程维护多个IO操作,使用 select 可以防止同步非阻塞IO中 线程轮训等待的问题。select 可以一次性将 N 个客户端连接传入内核 进入等待,交由内核轮询,当一个或多个连接有事件发生时,解除阻塞并返回事件列表。重点是,这样解决了 用户态到内核态因轮询导致的多次切换,也避免了多线程间上下文的切换。</font>
<font style="color:rgb(55, 53, 47);">信号驱动IO:相当于半异步的IO,注册一个信号回调函数直接返回,不阻塞,等到内核数据准备好后,调用信号回调函数,函数中调用 read方法 读写数据到 用户空间,后半部分不是异步的。</font>
<font style="color:rgb(55, 53, 47);">异步IO:用户线程 read的同时 注册一个回调函数,read后直接返回,当内核数据准备好后并拷贝到用户空间完成后,调用制定的回调函数进行处理,整个过程用户线程不阻塞。</font>
<font style="color:rgb(55, 53, 47);">2、NioEndpoint 组件</font>
<font style="color:rgb(55, 53, 47);">Tomcat 的 NioEndpoint 组件实现了 I/O 多路复用模型,总体工作流程如下:</font>
- <font style="color:rgb(55, 53, 47);">创建一个 Selector,在它身上注册各种感兴趣的事件,然后调用 select 方法,等待感兴趣的事情发生。</font>
- <font style="color:rgb(55, 53, 47);">感兴趣的事情发生了,比如可以读了,这时便创建一个新的线程从 Channel 中读数据。</font>
<font style="color:rgb(55, 53, 47);">它一共包含 LimitLatch、Acceptor、Poller、SocketProcessor 和 Executor 共 5 个组件。</font>
<!-- 这是一张图片,ocr 内容为: -->
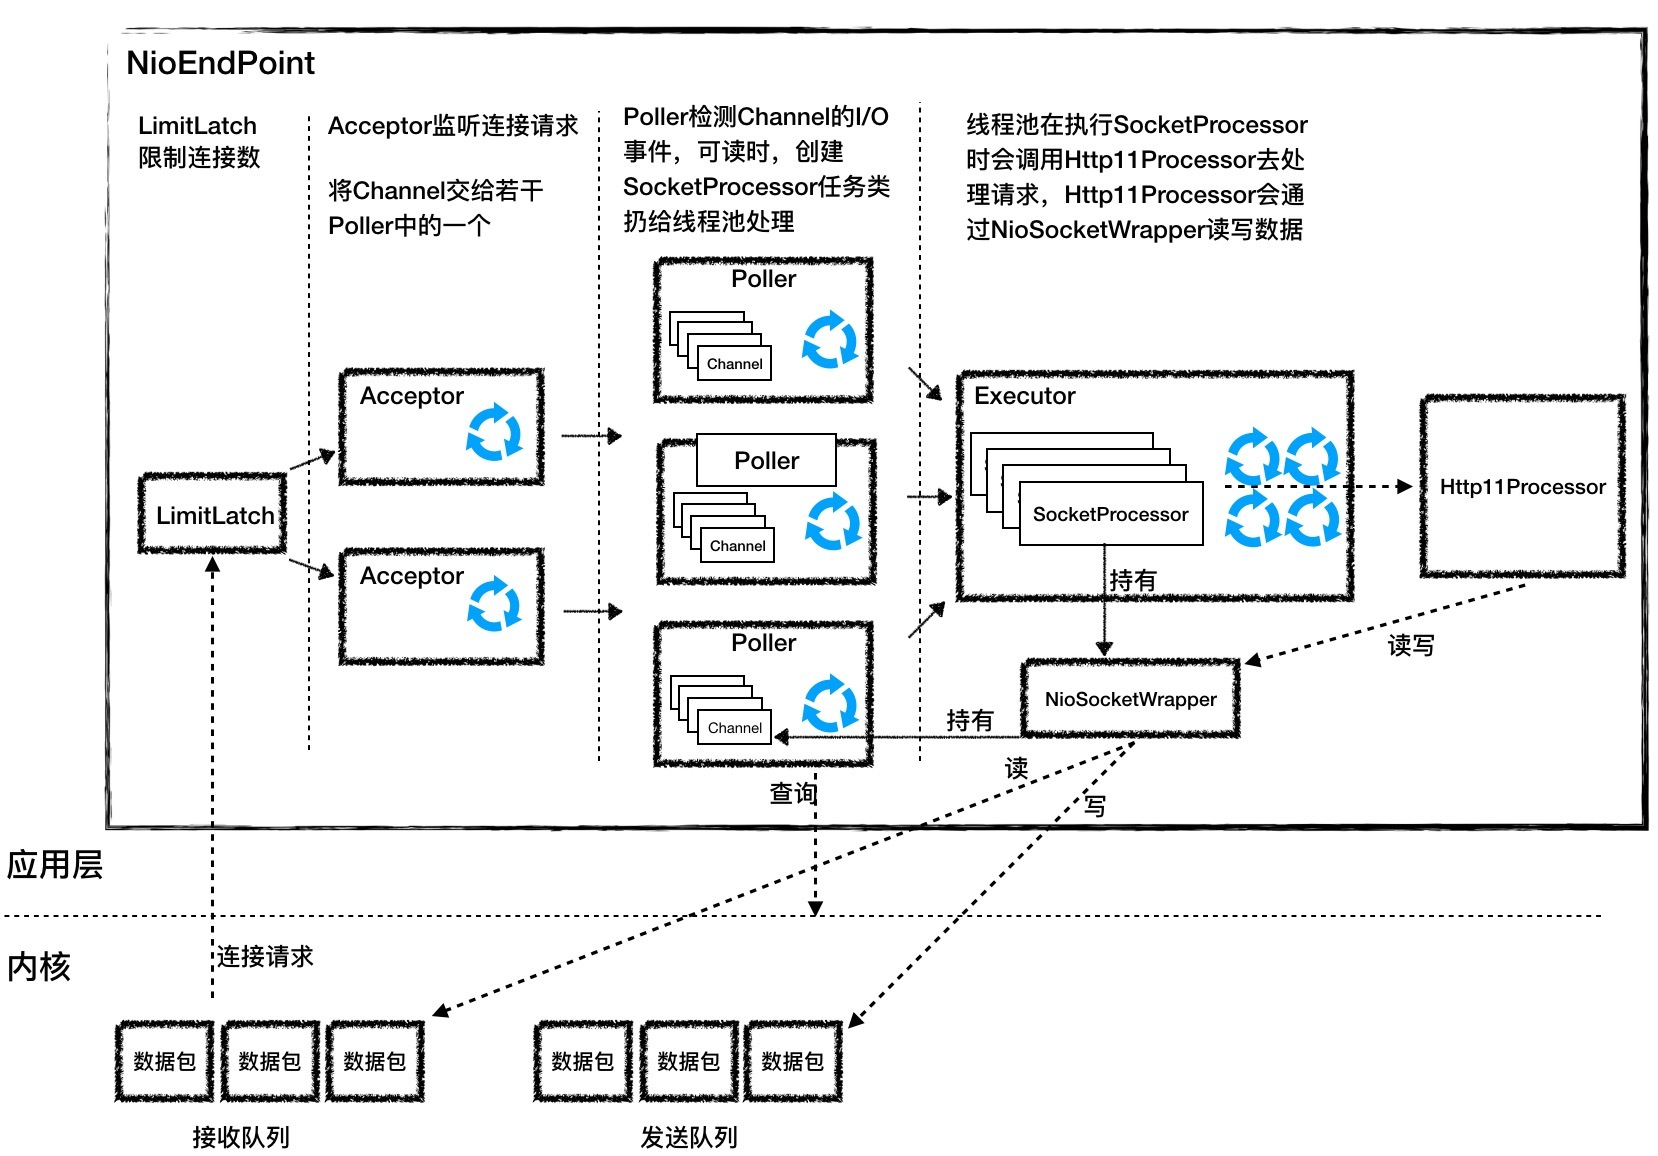
<font style="color:rgb(55, 53, 47);">1、LimitLatch 是连接控制器,它负责控制最大连接数,NIO 模式下默认是 10000,达到这个阈值后,连接请求被拒绝。</font>
<font style="color:rgb(55, 53, 47);">2、Acceptor 跑在一个单独的线程里,它在一个死循环里调用 accept 方法来接收新连接,一旦有新的连接请求到来,accept 方法返回一个 Channel 对象,接着把 Channel 对象交给 Poller 去处理。</font>
<font style="color:rgb(55, 53, 47);">3、Poller 的本质是一个 Selector,也跑在单独线程里。Poller 在内部维护一个 Channel 数组,它在一个死循环里不断检测 Channel 的数据就绪状态,一旦有 Channel 可读,就生成一个 SocketProcessor 任务对象扔给 Executor 去处理。</font>
<font style="color:rgb(55, 53, 47);">4、Executor 就是线程池,负责运行 SocketProcessor 任务类,SocketProcessor 的 run 方法会调用 Http11Processor 来读取和解析请求数据。我们知道,Http11Processor 是应用层协议的封装,它会调用容器获得响应,再把响应通过 Channel 写出。</font>
<font style="color:rgb(55, 53, 47);">3、Nio2Endpoint 组件</font>
<font style="color:rgb(55, 53, 47);">4、AprEndpoint 组件</font>
<font style="color:rgb(55, 53, 47);">5、Tomcat 扩展的线程池</font>
<font style="color:rgb(55, 53, 47);">平时开发的Web系统通常都有大量的 IO 操作,比方说查询数据库、查询缓存等等。任务在执行 IO 操作的时候 CPU就空闲了下来,这时如果增加执行任务的线程数而不是把任务暂存在队列中,就可以在单位时间内执行更多的任务,大大提高了任务执行的吞吐量。 </font>
<font style="color:rgb(55, 53, 47);">Tomcat 使用的线程池就不是 JDK 原生的线程池,而是做了一些改造,当</font><font style="color:rgb(55, 53, 47);">线程数超过 coreThreadCount 之后会优先创建线程</font><font style="color:rgb(55, 53, 47);">,直到线程数到达 maxThreadCount,这样就比较适合于 Web 系统大量 IO 操作的场景了</font>
<font style="color:rgb(55, 53, 47);">6、Tomcat WebSocket</font>
<font style="color:rgb(55, 53, 47);">7、内核如何阻塞唤醒进程</font>
<font style="color:rgb(55, 53, 47);">8、Logger 组件</font>
<font style="color:rgb(55, 53, 47);">日志模块作为一个通用的功能,在系统里通常会使用第三方的日志框架。</font>
<font style="color:rgb(55, 53, 47);">Java 的日志框架有很多,比如:JUL(Java Util Logging)、Log4j、Logback、Log4j2、Tinylog 等。除此之外,还有 JCL(Apache Commons Logging)和 SLF4J 这样的“</font><font style="color:rgb(55, 53, 47);">门面日志</font><font style="color:rgb(55, 53, 47);">”。</font>
<font style="color:rgb(55, 53, 47);">“门面日志”利用了设计模式中的门面模式思想,对外提供一套通用的日志记录的 API,而不提供具体的日志输出服务,如果要实现日志输出,需要集成其他的日志框架</font><font style="color:rgb(55, 53, 47);">,比如 Log4j、Logback、Log4j2 等。</font>
<font style="color:rgb(55, 53, 47);">这种门面模式的好处在于,记录日志的 API 和日志输出的服务分离开,当我们需要改变系统的日志输出服务时,不用修改代码,只需要改变引入日志输出框架 JAR 包。</font>
<font style="color:rgb(55, 53, 47);">Java 日志系统</font>
<font style="color:rgb(55, 53, 47);">Java 的日志包在java.util.logging路径下,包含了几个比较重要的组件:</font>
<!-- 这是一张图片,ocr 内容为: -->
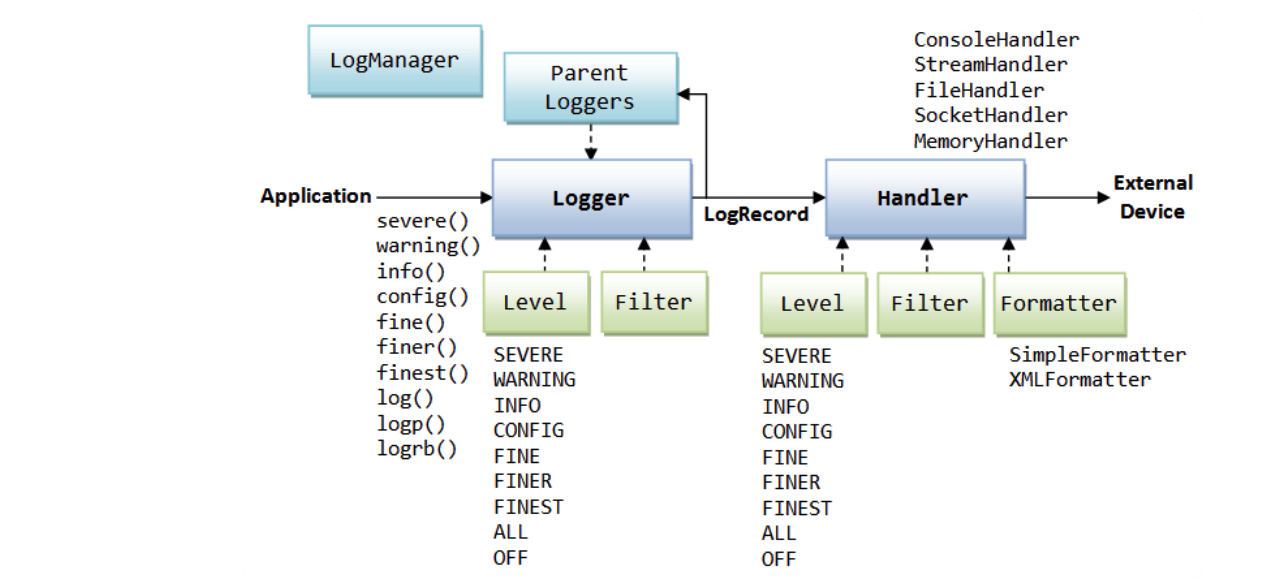
<font style="color:rgb(55, 53, 47);">Logger:用来记录日志的类。</font>
<font style="color:rgb(55, 53, 47);">Handler:规定了日志的输出方式,如控制台输出、写入文件。</font>
<font style="color:rgb(55, 53, 47);">Level:定义了日志的不同等级。</font>
<font style="color:rgb(55, 53, 47);">Formatter:将日志信息格式化,比如纯文本、XML。</font>
plain
| 1 | public static void main(String[] args) { |
| 2 | Logger logger = Logger.getLogger("com.mycompany.myapp"); |
| 3 | logger.setLevel(Level.FINE); |
| 4 | logger.setUseParentHandlers(false); |
| 5 | Handler hd = new ConsoleHandler(); |
| 6 | hd.setLevel(Level.FINE); |
| 7 | logger.addHandler(hd); |
| 8 | logger.info("start log"); |
| 9 | } |
<font style="color:rgb(55, 53, 47);">Tomcat 的 JULI</font>
<font style="color:rgb(55, 53, 47);">JULI 对日志的处理方式与 Java 自带的基本一致,但是 Tomcat 中可以包含多个应用,而每个应用的日志系统应该相互独立。</font><font style="color:rgb(55, 53, 47);">Java 的原生日志系统是每个 JVM 有一份日志的配置文件,这不符合 Tomcat 多应用的场景,所以 JULI 重新实现了一些日志接口。</font>
<font style="color:rgb(55, 53, 47);">Log 的基础实现类是 DirectJDKLog,这个类相对简单,就包装了一下 Java 的 Logger 类。但是它也在原来的基础上进行了一些修改,比如修改默认的格式化方式。</font>
<font style="color:rgb(55, 53, 47);">Log 使用了工厂模式来向外提供实例,LogFactory 是一个单例,可以通过 SeviceLoader 为 Log 提供自定义的实现版本,如果没有配置,就默认使用 DirectJDKLog。</font>
<font style="color:rgb(55, 53, 47);">Handler</font>
<font style="color:rgb(55, 53, 47);">在 JULI 中就自定义了两个 Handler:FileHandler 和 AsyncFileHandler。</font>
<font style="color:rgb(55, 53, 47);">FileHandler 可以简单地理解为一个在特定位置写文件的工具类,有一些写操作常用的方法,如 open、write(publish)、close、flush 等,使用了读写锁。其中的日志信息通过 Formatter 来格式化。</font>
<font style="color:rgb(55, 53, 47);">AsyncFileHandler 继承自 FileHandler,实现了异步的写操作。其中缓存存储是通过阻塞双端队列 LinkedBlockingDeque 来实现的。当应用要通过这个 Handler 来记录一条消息时,消息会先被存储到队列中,而在后台会有一个专门的线程来处理队列中的消息,取出的消息会通过父类的 publish 方法写入相应文件内。这样就</font><font style="color:rgb(55, 53, 47);">可以在大量日志需要写入的时候起到缓冲作用,防止都阻塞在写日志这个动作上</font><font style="color:rgb(55, 53, 47);">。需要注意的是,我们</font><font style="color:rgb(55, 53, 47);">可以为阻塞双端队列设置不同的模式,在不同模式下,对新进入的消息有不同的处理方式</font><font style="color:rgb(55, 53, 47);">,有些模式下会直接丢弃一些日志:</font>
plain
| 1 | OVERFLOW_DROP_LAST:丢弃栈顶的元素 |
| 2 | OVERFLOW_DROP_FIRSH:丢弃栈底的元素 |
| 3 | OVERFLOW_DROP_FLUSH:等待一定时间并重试,不会丢失元素 |
| 4 | OVERFLOW_DROP_CURRENT:丢弃放入的元素 |
<font style="color:rgb(55, 53, 47);">Formatter</font>
<font style="color:rgb(55, 53, 47);">Formatter 通过一个 format 方法将日志记录 LogRecord 转化成格式化的字符串,JULI 提供了三个新的 Formatter。</font>
- <font style="color:rgb(55, 53, 47);">OnlineFormatter:基本与 Java 自带的 SimpleFormatter 格式相同,不过把所有内容都写到了一行中。</font>
- <font style="color:rgb(55, 53, 47);">VerbatimFormatter:只记录了日志信息,没有任何额外的信息。</font>
- <font style="color:rgb(55, 53, 47);">JdkLoggerFormatter:格式化了一个轻量级的日志信息。</font>
<font style="color:rgb(55, 53, 47);">日志配置</font>
<font style="color:rgb(55, 53, 47);">Tomcat 的日志配置文件为 Tomcat 文件夹下conf/logging.properties。首先可以看到各种 Handler 的配置:</font>
plain
| 1 | handlers = 1catalina.org.apache.juli.AsyncFileHandler, 2localhost.org.apache.juli.AsyncFileHandler, 3manager.org.apache.juli.AsyncFileHandler, 4host-manager.org.apache.juli.AsyncFileHandler, java.util.logging.ConsoleHandler |
| 2 | |
| 3 | .handlers = 1catalina.org.apache.juli.AsyncFileHandler, java.util.logging.ConsoleHandler |
<font style="color:rgb(55, 53, 47);">以1catalina.org.apache.juli.AsyncFileHandler为例,数字是为了区分同一个类的不同实例;catalina、localhost、manager 和 host-manager 是 Tomcat 用来区分不同系统日志的标志;后面的字符串表示了 Handler 具体类型,如果要添加 Tomcat 服务器的自定义 Handler,需要在字符串里添加。</font>
<font style="color:rgb(55, 53, 47);">接下来是每个 Handler 设置日志等级、目录和文件前缀,自定义的 Handler 也要在这里配置详细信息:</font>
plain
| 1 | 1catalina.org.apache.juli.AsyncFileHandler.level = FINE |
| 2 | 1catalina.org.apache.juli.AsyncFileHandler.directory = ${catalina.base}/logs |
| 3 | 1catalina.org.apache.juli.AsyncFileHandler.prefix = catalina. |
| 4 | 1catalina.org.apache.juli.AsyncFileHandler.maxDays = 90 |
| 5 | 1catalina.org.apache.juli.AsyncFileHandler.encoding = UTF-8 |
<font style="color:rgb(55, 53, 47);">9、Mangger 组件</font>
<font style="color:rgb(55, 53, 47);">Session 的管理是由 Web 容器来完成的,主要是对 Session 的创建和销毁,除此之外 Web 容器还需要将 Session 状态的变化通知给监听者。</font>
<font style="color:rgb(55, 53, 47);">当然 Session 管理还可以交给 Spring 来做,好处是与特定的 Web 容器解耦,</font><u><font style="color:rgb(55, 53, 47);">Spring Session 的核心原理是通过 Filter 拦截 Servlet 请求,将标准的 ServletRequest 包装一下,换成 Spring 的 Request 对象,这样当我们调用 Request 对象的 getSession 方法时,Spring 在背后为我们创建和管理 Session。</font></u>
<font style="color:rgb(55, 53, 47);">Tomcat 中 Session的创建</font>
<font style="color:rgb(55, 53, 47);">Tomcat 中主要由每个 Context 容器内的一个 Manager 对象管理 Session,默认实现是:StandardManager。</font>
plain
| 1 | public interface Manager { |
| 2 | public Context getContext(); |
| 3 | public void setContext(Context context); |
| 4 | public SessionIdGenerator getSessionIdGenerator(); |
| 5 | public void setSessionIdGenerator(SessionIdGenerator sessionIdGenerator); |
| 6 | public long getSessionCounter(); |
| 7 | public void setSessionCounter(long sessionCounter); |
| 8 | public int getMaxActive(); |
| 9 | public void setMaxActive(int maxActive); |
| 10 | public int getActiveSessions(); |
| 11 | public long getExpiredSessions(); |
| 12 | public void setExpiredSessions(long expiredSessions); |
| 13 | public int getRejectedSessions(); |
| 14 | public int getSessionMaxAliveTime(); |
| 15 | public void setSessionMaxAliveTime(int sessionMaxAliveTime); |
| 16 | public int getSessionAverageAliveTime(); |
| 17 | public int getSessionCreateRate(); |
| 18 | public int getSessionExpireRate(); |
| 19 | public void add(Session session); |
| 20 | public void changeSessionId(Session session); |
| 21 | public void changeSessionId(Session session, String newId); |
| 22 | public Session createEmptySession(); |
| 23 | public Session createSession(String sessionId); |
| 24 | public Session findSession(String id) throws IOException; |
| 25 | public Session[] findSessions(); |
| 26 | public void load() throws ClassNotFoundException, IOException; |
| 27 | public void remove(Session session); |
| 28 | public void remove(Session session, boolean update); |
| 29 | public void addPropertyChangeListener(PropertyChangeListener listener) |
| 30 | public void removePropertyChangeListener(PropertyChangeListener listener); |
| 31 | public void unload() throws IOException; |
| 32 | public void backgroundProcess(); |
| 33 | public boolean willAttributeDistribute(String name, Object value); |
| 34 | } |
<font style="color:rgb(55, 53, 47);">接口中有添加和删除 Session 的方法;另外还有 load 和 unload 方法,它们的作用是分别是将 Session 持久化到存储介质和从存储介质加载 Session。</font>
<font style="color:rgb(55, 53, 47);">当我们调用HttpServletRequest.getSession(true)时,这个参数 true 的意思是“如果当前请求还没有 Session,就创建一个新的”。</font>
<font style="color:rgb(55, 53, 47);">HttpServletRequest 是一个接口,Tomcat 实现了这个接口,具体实现类是:org.apache.catalina.connector.Request。</font>
<font style="color:rgb(55, 53, 47);">但这并不是我们拿到的 Request,Tomcat 为了避免把一些实现细节暴露出来,还有</font><font style="color:rgb(55, 53, 47);">基于安全上的考虑,定义了 Request 的包装类,叫作 RequestFacade</font><font style="color:rgb(55, 53, 47);">,我们可以通过代码来理解一下:</font>
plain
| 1 | public class Request implements HttpServletRequest {} |
plain
| 1 | public class RequestFacade implements HttpServletRequest { |
| 2 | protected Request request = null; |
| 3 | |
| 4 | public HttpSession getSession(boolean create) { |
| 5 | return request.getSession(create); |
| 6 | } |
| 7 | } |
<font style="color:rgb(55, 53, 47);">因此我们拿到的 Request 类其实是 RequestFacade,RequestFacade 的 getSession 方法调用的是 Request 类的 getSession 方法。</font>
plain
| 1 | Context context = getContext(); |
| 2 | if (context == null) { |
| 3 | return null; |
| 4 | } |
| 5 | |
| 6 | Manager manager = context.getManager(); |
| 7 | if (manager == null) { |
| 8 | return null; |
| 9 | } |
| 10 | |
| 11 | session = manager.createSession(sessionId); |
| 12 | session.access(); |
<font style="color:rgb(55, 53, 47);">所以,Request 对象中持有 Context 容器对象,而 Context 容器持有 Session 管理器 Manager,这样通过 Context 组件就能拿到 Manager 组件,最后由 Manager 组件来创建 Session。</font>
<font style="color:rgb(55, 53, 47);">因此最后还是到了 StandardManager,StandardManager 的父类叫 ManagerBase,这个 createSession 方法定义在 ManagerBase 中,StandardManager 直接重用这个方法。</font>
plain
| 1 | @Override |
| 2 | public Session createSession(String sessionId) { |
| 3 | //首先判断Session数量是不是到了最大值,最大Session数可以通过参数设置 |
| 4 | if ((maxActiveSessions >= 0) && |
| 5 | (getActiveSessions() >= maxActiveSessions)) { |
| 6 | rejectedSessions++; |
| 7 | throw new TooManyActiveSessionsException( |
| 8 | sm.getString("managerBase.createSession.ise"), |
| 9 | maxActiveSessions); |
| 10 | } |
| 11 | |
| 12 | // 重用或者创建一个新的Session对象,请注意在Tomcat中就是StandardSession |
| 13 | // 它是HttpSession的具体实现类,而HttpSession是Servlet规范中定义的接口 |
| 14 | Session session = createEmptySession(); |
| 15 | |
| 16 | |
| 17 | // 初始化新Session的值 |
| 18 | session.setNew(true); |
| 19 | session.setValid(true); |
| 20 | session.setCreationTime(System.currentTimeMillis()); |
| 21 | session.setMaxInactiveInterval(getContext().getSessionTimeout() * 60); |
| 22 | String id = sessionId; |
| 23 | if (id == null) { |
| 24 | id = generateSessionId(); |
| 25 | } |
| 26 | session.setId(id);// 这里会将Session添加到ConcurrentHashMap中 |
| 27 | sessionCounter++; |
| 28 | |
| 29 | //将创建时间添加到LinkedList中,并且把最先添加的时间移除 |
| 30 | //主要还是方便清理过期Session |
| 31 | SessionTiming timing = new SessionTiming(session.getCreationTime(), 0); |
| 32 | synchronized (sessionCreationTiming) { |
| 33 | sessionCreationTiming.add(timing); |
| 34 | sessionCreationTiming.poll(); |
| 35 | } |
| 36 | return session |
| 37 | } |
<font style="color:rgb(55, 53, 47);">请注意 Session 的具体实现类是 StandardSession,StandardSession 同时实现了javax.servlet.http.HttpSession和org.apache.catalina.Session接口,并且对程序员暴露的是 StandardSessionFacade 外观类,保证了 StandardSession 的安全,避免了程序员调用其内部方法进行不当操作。StandardSession 的核心成员变量如下:</font>
plain
| 1 | public class StandardSession implements HttpSession, Session, Serializable { |
| 2 | protected ConcurrentMap<String, Object> attributes = new ConcurrentHashMap<>(); |
| 3 | protected long creationTime = 0L; |
| 4 | protected transient volatile boolean expiring = false; |
| 5 | protected transient StandardSessionFacade facade = null; |
| 6 | protected String id = null; |
| 7 | protected volatile long lastAccessedTime = creationTime; |
| 8 | protected transient ArrayList<SessionListener> listeners = new ArrayList<>(); |
| 9 | protected transient Manager manager = null; |
| 10 | protected volatile int maxInactiveInterval = -1; |
| 11 | protected volatile boolean isNew = false; |
| 12 | protected volatile boolean isValid = false; |
| 13 | protected transient Map<String, Object> notes = new Hashtable<>(); |
| 14 | protected transient Principal principal = null; |
| 15 | } |
<font style="color:rgb(55, 53, 47);">Tomcat 中 Session的清理</font>
<font style="color:rgb(55, 53, 47);">容器组件会开启一个 ContainerBackgroundProcessor 后台线程,调用自己以及子容器的 backgroundProcess 进行一些后台逻辑的处理,和 Lifecycle 一样,这个动作也是具有传递性的,也就是说子容器还会把这个动作传递给自己的子容器。</font>
<font style="color:rgb(55, 53, 47);">其中父容器会遍历所有的子容器并调用其 backgroundProcess 方法,而 StandardContext 重写了该方法,它会调用 StandardManager 的 backgroundProcess 进而完成 Session 的清理工作,下面是 StandardManager 的 backgroundProcess 方法的代码:</font>
plain
| 1 | public void backgroundProcess() { |
| 2 | // processExpiresFrequency 默认值为6,而backgroundProcess默认每隔10s调用一次,也就是说除了任务执行的耗时,每隔 60s 执行一次 |
| 3 | count = (count + 1) % processExpiresFrequency; |
| 4 | if (count == 0) // 默认每隔 60s 执行一次 Session 清理 |
| 5 | processExpires(); |
| 6 | } |
| 7 | |
| 8 | /** |
| 9 | * 单线程处理,不存在线程安全问题 |
| 10 | */ |
| 11 | public void processExpires() { |
| 12 | |
| 13 | // 获取所有的 Session |
| 14 | Session sessions[] = findSessions(); |
| 15 | int expireHere = 0 ; |
| 16 | for (int i = 0; i < sessions.length; i++) { |
| 17 | // Session 的过期是在isValid()方法里处理的 |
| 18 | if (sessions[i]!=null && !sessions[i].isValid()) { |
| 19 | expireHere++; |
| 20 | } |
| 21 | } |
| 22 | } |
<font style="color:rgb(55, 53, 47);">Tomcat 中 Session的通知机制</font>
<font style="color:rgb(55, 53, 47);">按照 Servlet 规范,在 Session 的生命周期过程中,要将事件通知监听者,Servlet 规范定义了 Session 的监听器接口:</font>
plain
| 1 | public interface HttpSessionListener extends EventListener { |
| 2 | //Session创建时调用 |
| 3 | public default void sessionCreated(HttpSessionEvent se) { |
| 4 | } |
| 5 | |
| 6 | //Session销毁时调用 |
| 7 | public default void sessionDestroyed(HttpSessionEvent se) { |
| 8 | } |
| 9 | } |
<font style="color:rgb(55, 53, 47);">两个方法的参数都是 HttpSessionEvent,所以 Tomcat 需要先创建 HttpSessionEvent 对象,然后遍历 Context 内部的 LifecycleListener,并且判断是否为 HttpSessionListener 实例,如果是的话则调用 HttpSessionListener 的 sessionCreated 方法进行事件通知。这些事情都是在 Session 的 setId 方法中完成的:</font>
plain
| 1 | session.setId(id); |
| 2 | |
| 3 | @Override |
| 4 | public void setId(String id, boolean notify) { |
| 5 | //如果这个id已经存在,先从Manager中删除 |
| 6 | if ((this.id != null) && (manager != null)) |
| 7 | manager.remove(this); |
| 8 | |
| 9 | this.id = id; |
| 10 | |
| 11 | //添加新的Session |
| 12 | if (manager != null) |
| 13 | manager.add(this); |
| 14 | |
| 15 | //这里面完成了HttpSessionListener事件通知 |
| 16 | if (notify) { |
| 17 | tellNew(); |
| 18 | } |
| 19 | } |
plain
| 1 | public void tellNew() { |
| 2 | |
| 3 | // 通知org.apache.catalina.SessionListener |
| 4 | fireSessionEvent(Session.SESSION_CREATED_EVENT, null); |
| 5 | |
| 6 | // 获取Context内部的LifecycleListener并判断是否为HttpSessionListener |
| 7 | Context context = manager.getContext(); |
| 8 | Object listeners[] = context.getApplicationLifecycleListeners(); |
| 9 | if (listeners != null && listeners.length > 0) { |
| 10 | |
| 11 | //创建HttpSessionEvent |
| 12 | HttpSessionEvent event = new HttpSessionEvent(getSession()); |
| 13 | for (int i = 0; i < listeners.length; i++) { |
| 14 | //判断是否是HttpSessionListener |
| 15 | if (!(listeners[i] instanceof HttpSessionListener)) |
| 16 | continue; |
| 17 | |
| 18 | HttpSessionListener listener = (HttpSessionListener) listeners[i]; |
| 19 | //注意这是容器内部事件 |
| 20 | context.fireContainerEvent("beforeSessionCreated", listener); |
| 21 | //触发Session Created 事件 |
| 22 | listener.sessionCreated(event); |
| 23 | |
| 24 | //注意这也是容器内部事件 |
| 25 | context.fireContainerEvent("afterSessionCreated", listener); |
| 26 | |
| 27 | } |
| 28 | } |
| 29 | } |
<font style="color:rgb(55, 53, 47);">先通过 StandardContext 将 HttpSessionListener 类型的 Listener 取出,然后依次调用它们的 sessionCreated 方法。</font>
<font style="color:rgb(55, 53, 47);">10、Cluster 组件</font>
<font style="color:rgb(55, 53, 47);">大集群用 Redis 保存 Session 小集群可以使用 Tomcat。</font>
<font style="color:rgb(55, 53, 47);">(未完)</font>
<font style="color:rgb(55, 53, 47);">11、如何监控 Tomcat 性能</font>
<font style="color:rgb(55, 53, 47);">1、Jconsole</font>
<font style="color:rgb(55, 53, 47);">Tomcat 的关键指标有吞吐量、响应时间、错误数、线程池、CPU 以及 JVM 内存。</font>
<font style="color:rgb(55, 53, 47);">前三个指标是我们最关心的业务指标,Tomcat 作为服务器,就是要能够又快有好地处理请求,因此吞吐量要大、响应时间要短,并且错误数要少。</font>
<font style="color:rgb(55, 53, 47);">后面三个指标是跟系统资源有关的,当某个资源出现瓶颈就会影响前面的业务指标,比如线程池中的线程数量不足会影响吞吐量和响应时间;但是线程数太多会耗费大量 CPU,也会影响吞吐量;当内存不足时会触发频繁地 GC,耗费 CPU,最后也会反映到业务指标上来。</font>
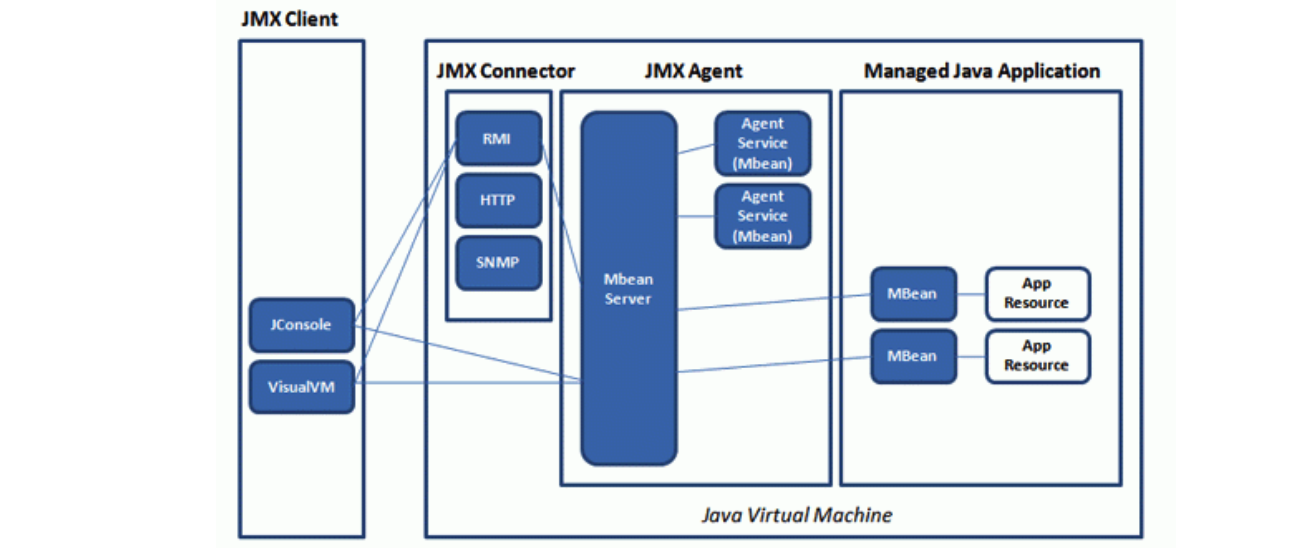
<font style="color:rgb(55, 53, 47);">Tomcat 可以通过 JMX 将上述指标暴露出来的。JMX(Java Management Extensions,即 Java 管理扩展)是一个为应用程序、设备、系统等植入监控管理功能的框架。JMX 使用管理 MBean 来监控业务资源,这些 MBean 在 JMX MBean 服务器上注册,代表 JVM 中运行的应用程序或服务。每个 MBean 都有一个属性列表。JMX 客户端可以连接到 MBean Server 来读写 MBean 的属性值。</font>
<!-- 这是一张图片,ocr 内容为: -->
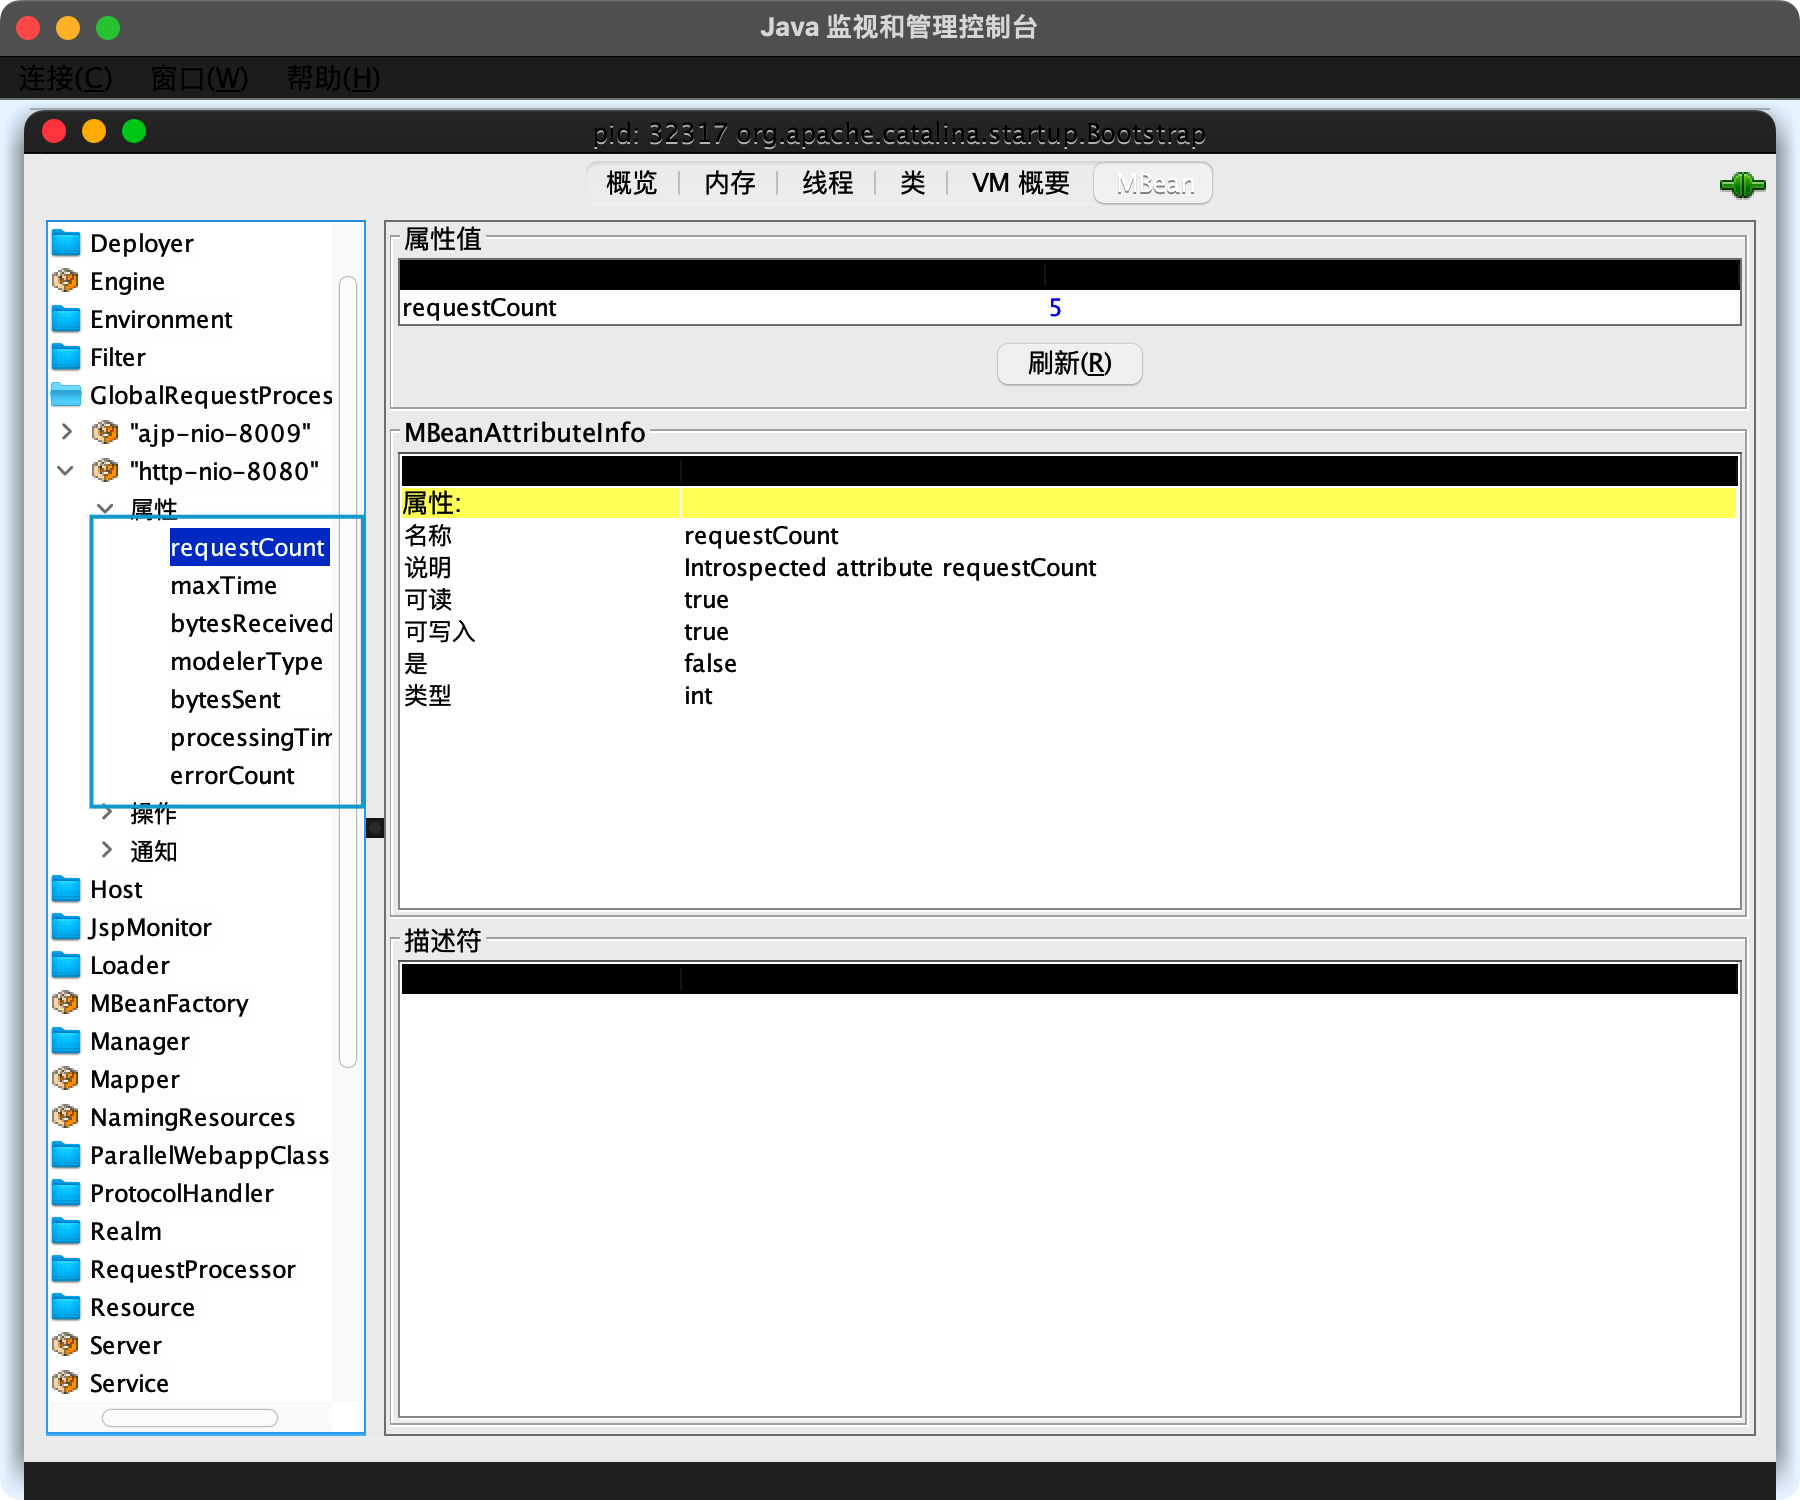
<font style="color:rgb(55, 53, 47);">吞吐量、响应时间、错误数在 MBeans 标签页下选择 GlobalRequestProcessor</font><font style="color:rgb(55, 53, 47);">,这里有 Tomcat 请求处理的统计信息。你会看到 Tomcat 中的各种连接器,展开“http-nio-8080”,你会看到这个连接器上的统计信息,其中 maxTime 表示最长的响应时间,processingTime 表示平均响应时间,requestCount 表示吞吐量,errorCount 就是错误数。</font>
<!-- 这是一张图片,ocr 内容为: -->
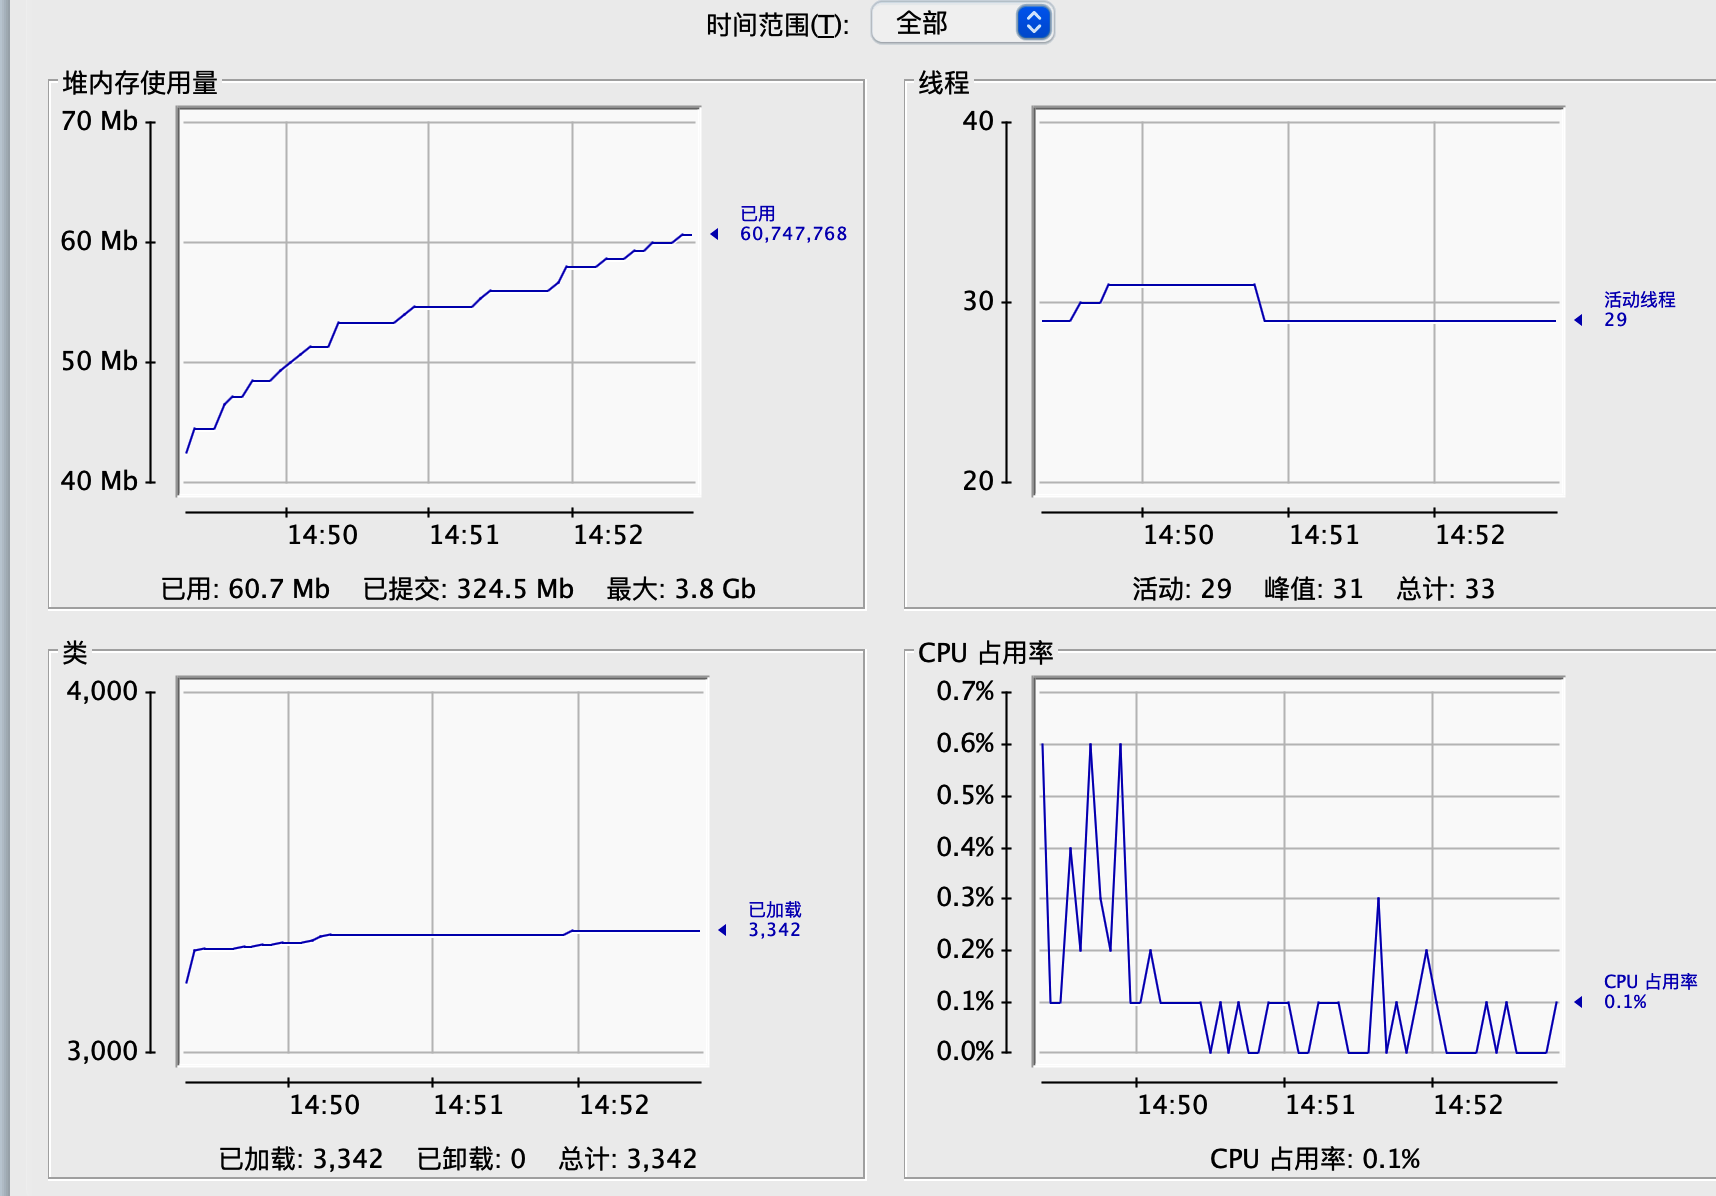
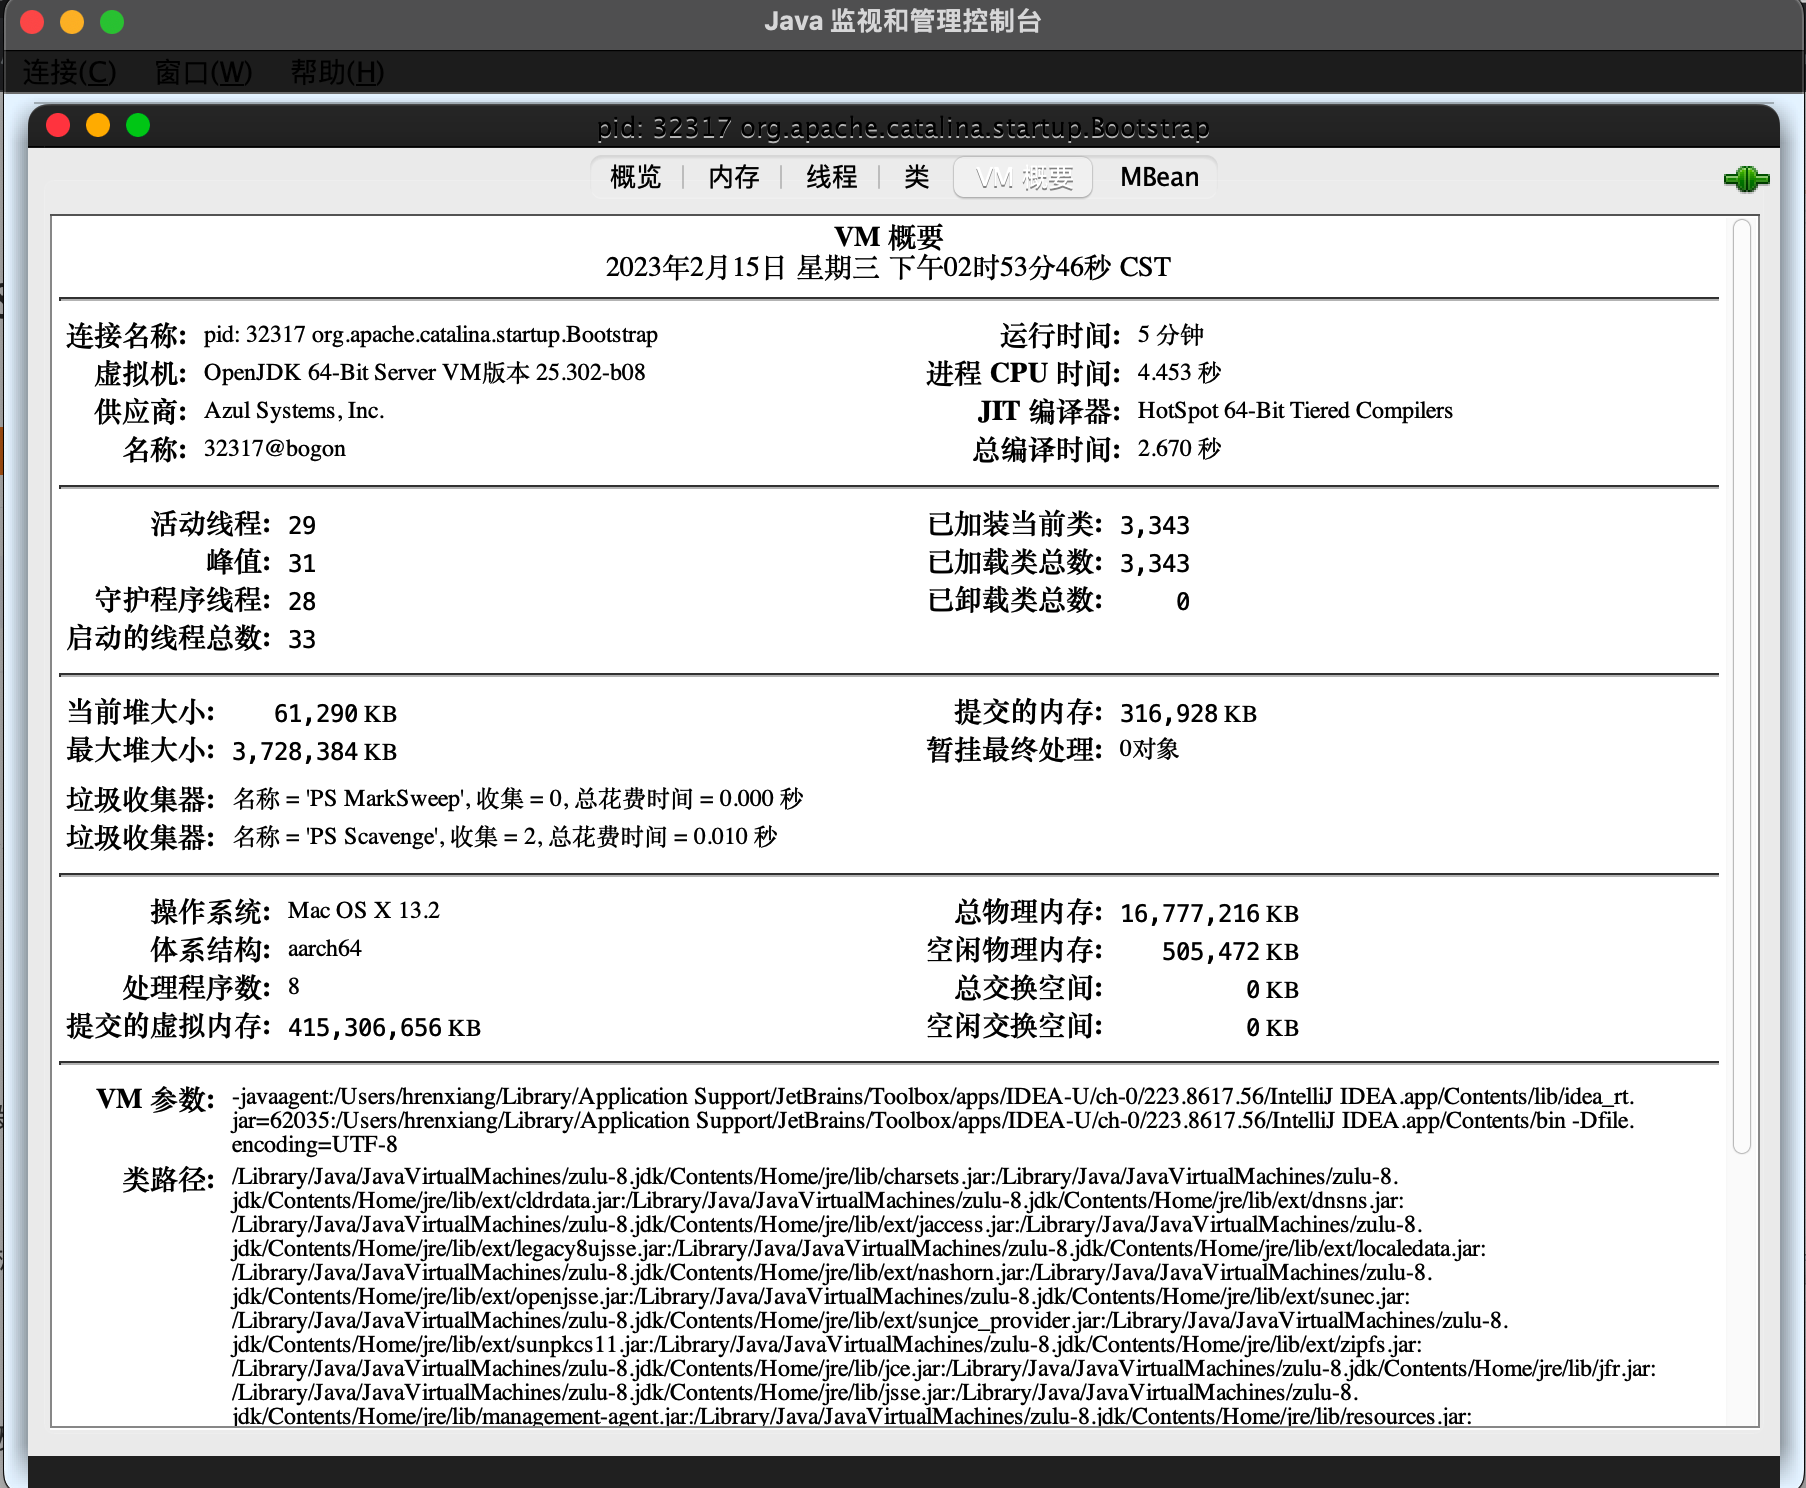
<font style="color:rgb(55, 53, 47);">线程池选择“线程”标签页,可以看到当前 Tomcat 进程中有多少线程</font><font style="color:rgb(55, 53, 47);">,如下图所示:</font>
<font style="color:rgb(55, 53, 47);">图的左下方是线程列表,右边是线程的运行栈,这些都是非常有用的信息。如果大量线程阻塞,通过观察线程栈,能看到线程阻塞在哪个函数,有可能是 I/O 等待,或者是死锁。</font>
<font style="color:rgb(55, 53, 47);">2、命令行</font>
<font style="color:rgb(55, 53, 47);">通过 ps 命令找到 Tomcat 进程,拿到进程 ID</font>
<font style="color:rgb(55, 53, 47);">查看进程状态的大致信息,通过cat/proc//status命令</font>
<font style="color:rgb(55, 53, 47);">监控进程的 CPU 和内存资源使用情况</font>
<font style="color:rgb(55, 53, 47);">查看 Tomcat 的网络连接,比如 Tomcat 在 8080 端口上监听连接请求,netstat -antp |grep 8080</font>
<font style="color:rgb(55, 53, 47);">通过 ifstat 来查看网络流量,大致可以看出 Tomcat 当前的请求数和负载状况。</font>
<font style="color:rgb(55, 53, 47);">12、Tomcat I/O 和 线程池并发调优</font>
<font style="color:rgb(55, 53, 47);">Tomcat 的调优涉及 I/O 模型和线程池调优、JVM 内存调优以及网络优化等。</font>
<font style="color:rgb(55, 53, 47);">I/O 调优指的是选择 NIO、NIO.2 还是 APR,而线程池调优指的是给 Tomcat 的线程池设置合适的参数,使得 Tomcat 能够又快又好地处理请求。</font>
<font style="color:rgb(55, 53, 47);">I/O 调优实际上是连接器类型的选择,一般情况下默认都是 NIO,在绝大多数情况下都是够用的,除非你的 Web 应用用到了 TLS 加密传输,而且对性能要求极高,这个时候可以考虑 APR,因为 APR 通过 OpenSSL 来处理 TLS 握手和加 / 解密。</font>
<font style="color:rgb(55, 53, 47);">Tomcat 线程池中有哪些关键参数:</font>
<!-- 这是一张图片,ocr 内容为: -->
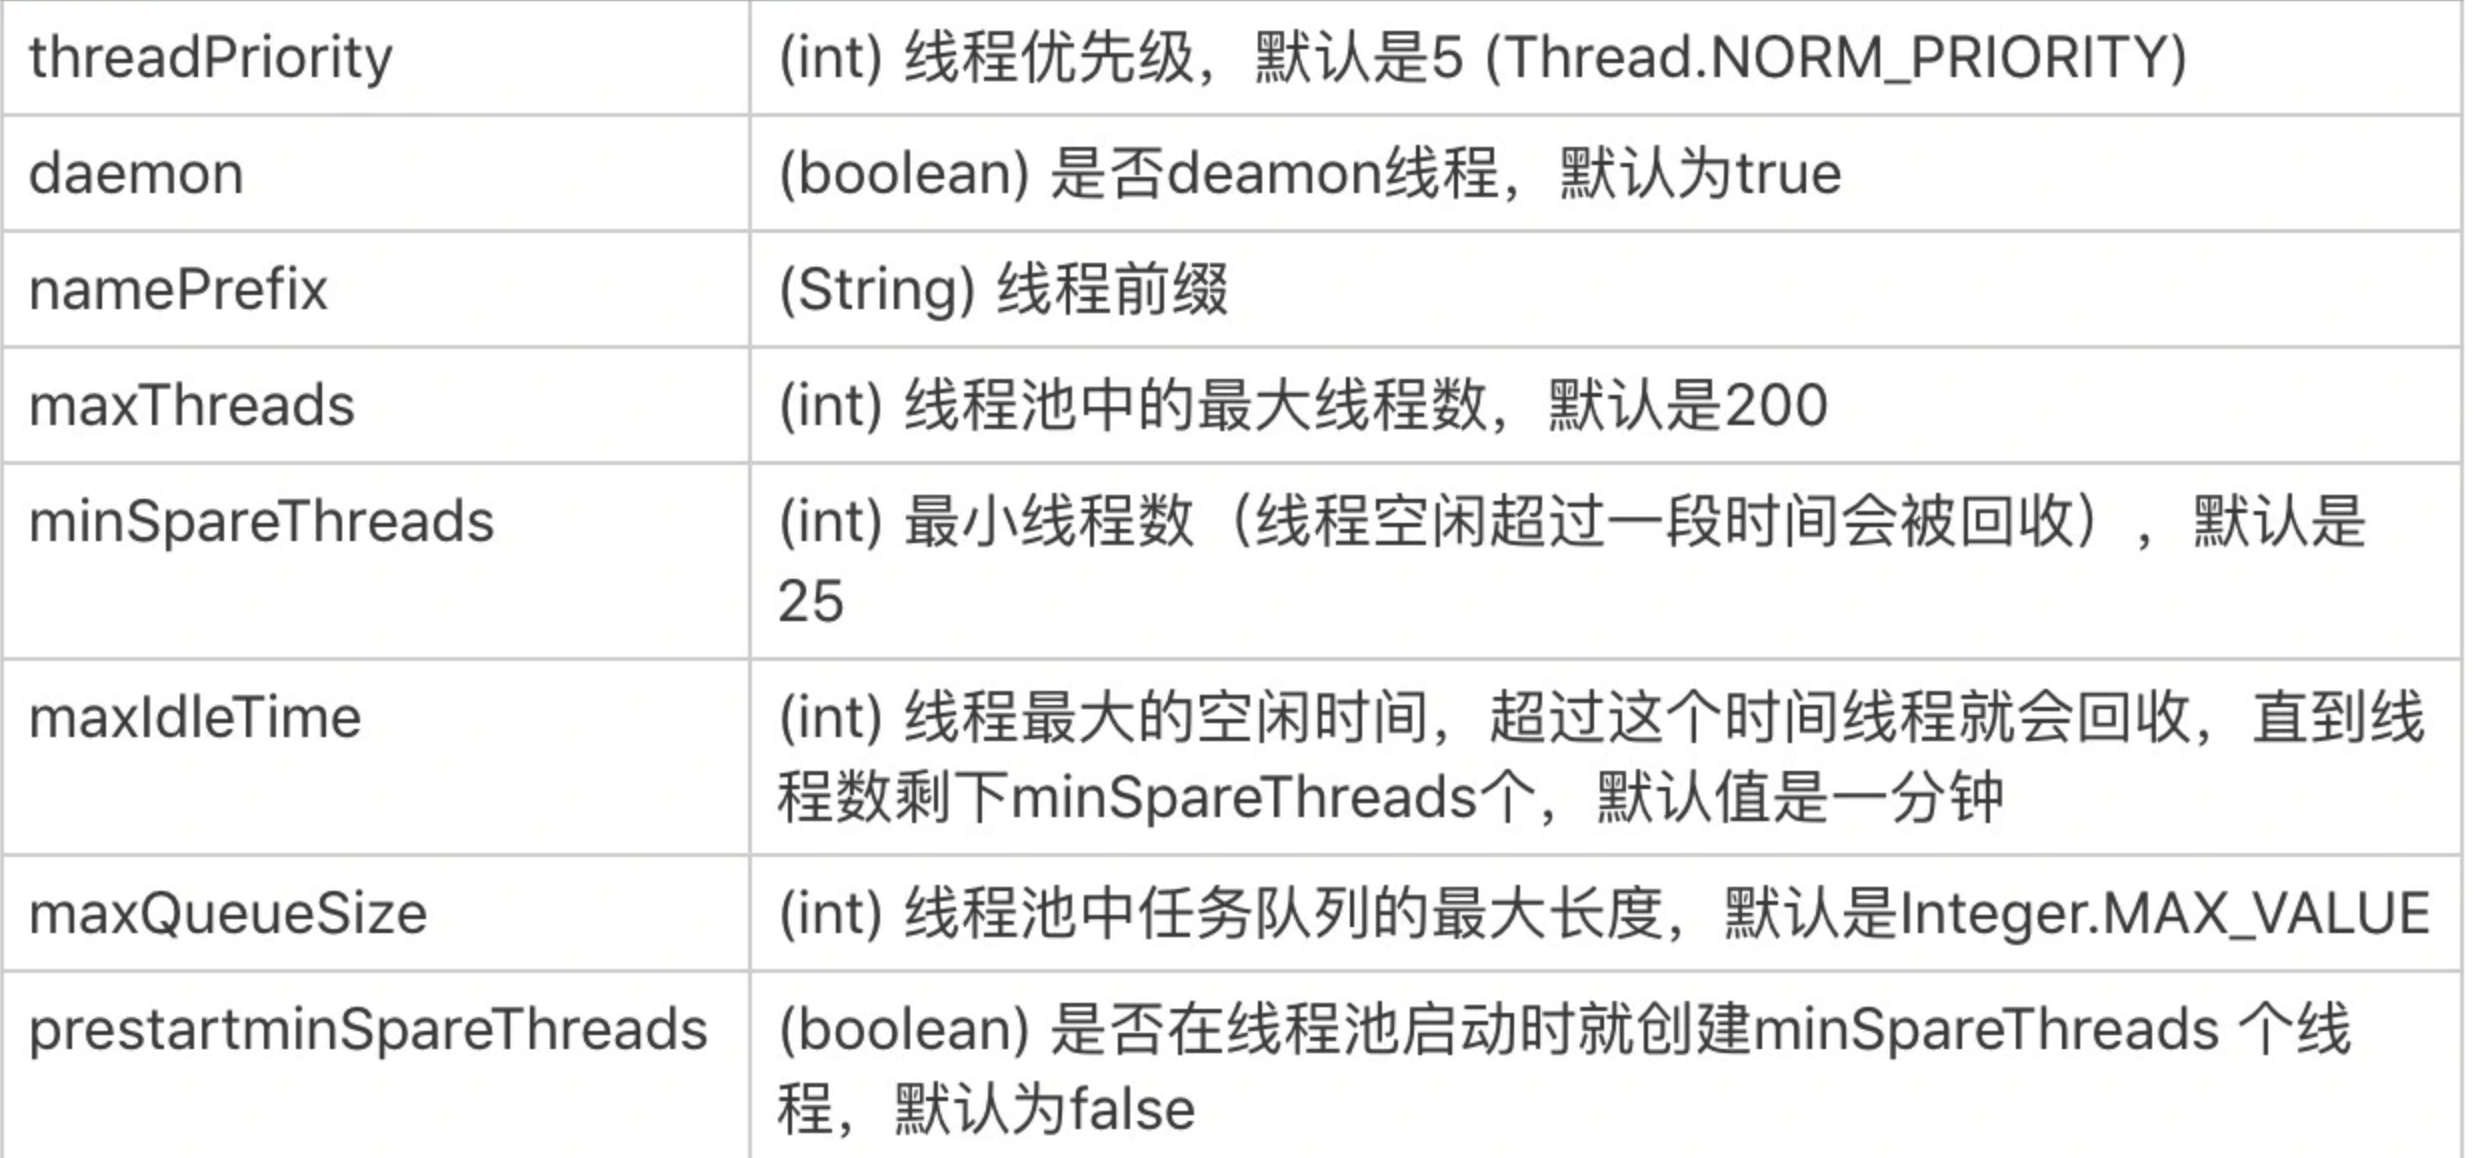
<font style="color:rgb(55, 53, 47);">最核心的就是如何确定 maxThreads 的值</font><font style="color:rgb(55, 53, 47);">,如果这个参数设置小了,Tomcat 会发生线程饥饿,并且请求的处理会在队列中排队等待,导致响应时间变长;如果 maxThreads 参数值过大,同样也会有问题,因为服务器的 CPU 的核数有限,线程数太多会导致线程在 CPU 上来回切换,耗费大量的切换开销。</font>
<font style="color:rgb(55, 53, 47);">利特尔法则:系统中的请求数 = 请求的到达速率 × 每个请求处理时间。</font>
<font style="color:rgb(55, 53, 47);">假设一个单核服务器在接收请求:</font>
- <font style="color:rgb(55, 53, 47);">如果每秒 10 个请求到达,平均处理一个请求需要 1 秒,那么服务器任何时候都有 10 个请求在处理,即需要 10 个线程。</font>
- <font style="color:rgb(55, 53, 47);">如果每秒 10 个请求到达,平均处理一个请求需要 2 秒,那么服务器在每个时刻都有 20 个请求在处理,因此需要 20 个线程。</font>
- <font style="color:rgb(55, 53, 47);">如果每秒 10000 个请求到达,平均处理一个请求需要 1 秒,那么服务器在每个时刻都有 10000 个请求在处理,因此需要 10000 个线程。</font>
<font style="color:rgb(55, 53, 47);">这是理想的情况,也就是说线程一直在忙着干活,没有被阻塞在 I/O 等待上。实际上任务在执行中,线程不可避免会发生阻塞,比如阻塞在 I/O 等待上,等待数据库或者下游服务的数据返回,虽然通过非阻塞 I/O 模型可以减少线程的等待,但是数据在用户空间和内核空间拷贝过程中,线程还是阻塞的。线程一阻塞就会让出 CPU,线程闲置下来,就好像工作人员不可能 24 小时不间断地处理客户的请求,解决办法就是增加工作人员的数量,一个人去休息另一个人再顶上。对应到线程池就是增加线程数量,因此 I/O 密集型应用需要设置更多的线程。</font>
<font style="color:rgb(55, 53, 47);">至此我们又得到一个线程池个数的计算公式,假设服务器是单核的:</font>
<font style="color:rgb(55, 53, 47);">线程池大小 = (线程 I/O 阻塞时间 + 线程 CPU 时间 )/ 线程 CPU 时间</font>
<font style="color:rgb(55, 53, 47);">其中:线程 I/O 阻塞时间 + 线程 CPU 时间 = 平均请求处理时间</font>
<font style="color:rgb(55, 53, 47);">实际情况下:先用上面两个公式大概算出理想的线程数,再反复压测调整,从而达到最优。</font>
<font style="color:rgb(55, 53, 47);">13、Tomcat 内存泄漏原因分析及调优</font>
<font style="color:rgb(55, 53, 47);">1、运行程序并打开 verbosegc,将 GC 的日志输出到 gc.log 文件中</font>
java -verbose:gc -Xloggc:gc.log -XX:+PrintGCDetails -jar mem-0.0.1-SNAPSHOT.jar
<font style="color:rgb(55, 53, 47);">2、使用jstat命令观察 GC 的过程:</font>
jstat -gc 94223 2000 1000
<font style="color:rgb(55, 53, 47);">94223 是程序的进程 ID,2000 表示每隔 2 秒执行一次,1000 表示持续执行 1000 次。下面是命令的输出:</font>
<!-- 这是一张图片,ocr 内容为: -->

<font style="color:rgb(55, 53, 47);">其中每一列的含义是:</font>
- <font style="color:rgb(55, 53, 47);">S0C:第一个 Survivor 区总的大小;</font>
- <font style="color:rgb(55, 53, 47);">S1C:第二个 Survivor 区总的大小;</font>
- <font style="color:rgb(55, 53, 47);">S0U:第一个 Survivor 区已使用内存的大小;</font>
- <font style="color:rgb(55, 53, 47);">S1U:第二个 Survivor 区已使用内存的大小。</font>
<font style="color:rgb(55, 53, 47);">后面的列相信从名字你也能猜出是什么意思了,其中 E 代表 Eden,O 代表 Old,M 代表 Metadata;YGC 表示 Minor GC 的总时间,YGCT 表示 Minor GC 的次数;FGC 表示 Full GC。通过这个工具,你能大概看到各个内存区域的大小、已经 GC 的次数和所花的时间。</font>
<font style="color:rgb(55, 53, 47);">verbosegc 参数对程序的影响比较小,因此很适合在生产环境现场使用。</font>
<font style="color:rgb(55, 53, 47);">3、通过 GCViewer 工具查看 GC 日志,用 GCViewer 打开第一步产生的 gc.log,会看到这样的图:</font>
<!-- 这是一张图片,ocr 内容为: -->
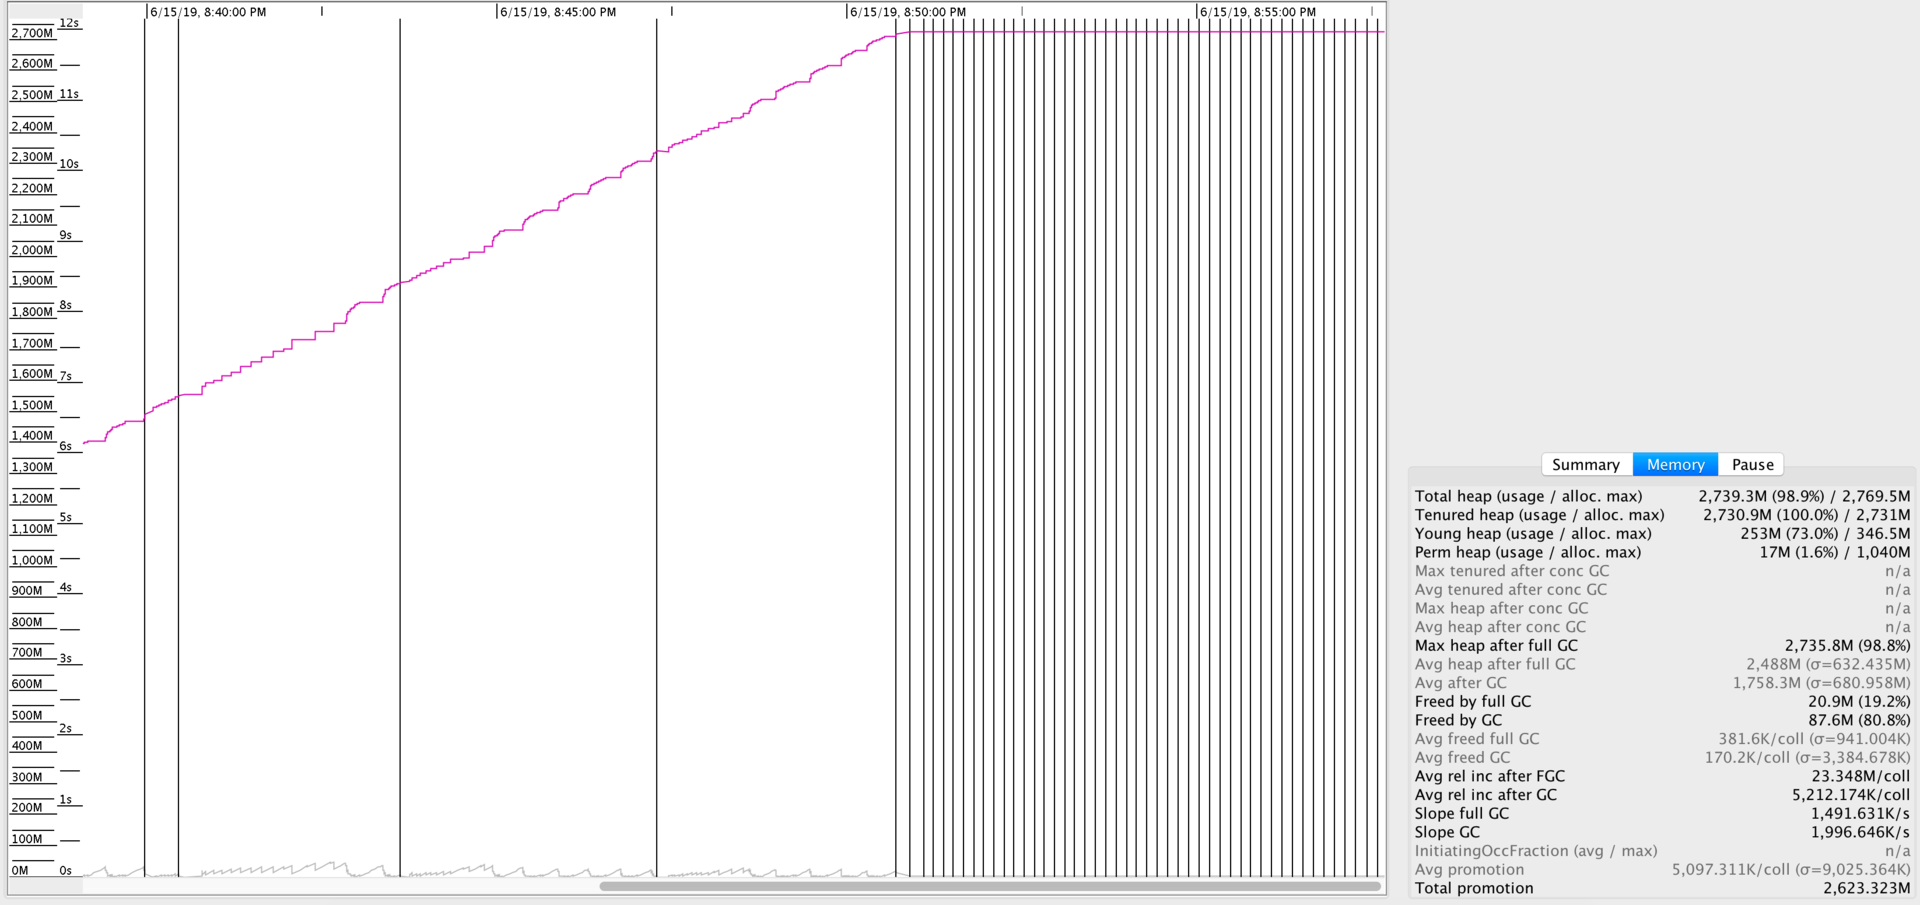
<font style="color:rgb(55, 53, 47);">图中红色的线表示年老代占用的内存,你会看到它一直在增加,而黑色的竖线表示一次 Full GC。你可以看到后期 JVM 在频繁地 Full GC,但是年老代的内存并没有降下来,这是典型的内存泄漏的特征。</font>
<font style="color:rgb(55, 53, 47);">除了内存泄漏,我们还可以通过 GCViewer 来观察 Minor GC 和 Full GC 的频次,已及每次的内存回收量。</font>
<font style="color:rgb(55, 53, 47);">4、为了找到内存泄漏点,我们通过 jmap 工具生成 Heap Dump:</font>
jmap -dump:live,format=b,file=94223.bin 94223
<font style="color:rgb(55, 53, 47);">5、用 Eclipse Memory Analyzer 打开 Dump 文件,通过内存泄漏分析,得到这样一个分析报告:</font>
<!-- 这是一张图片,ocr 内容为: -->
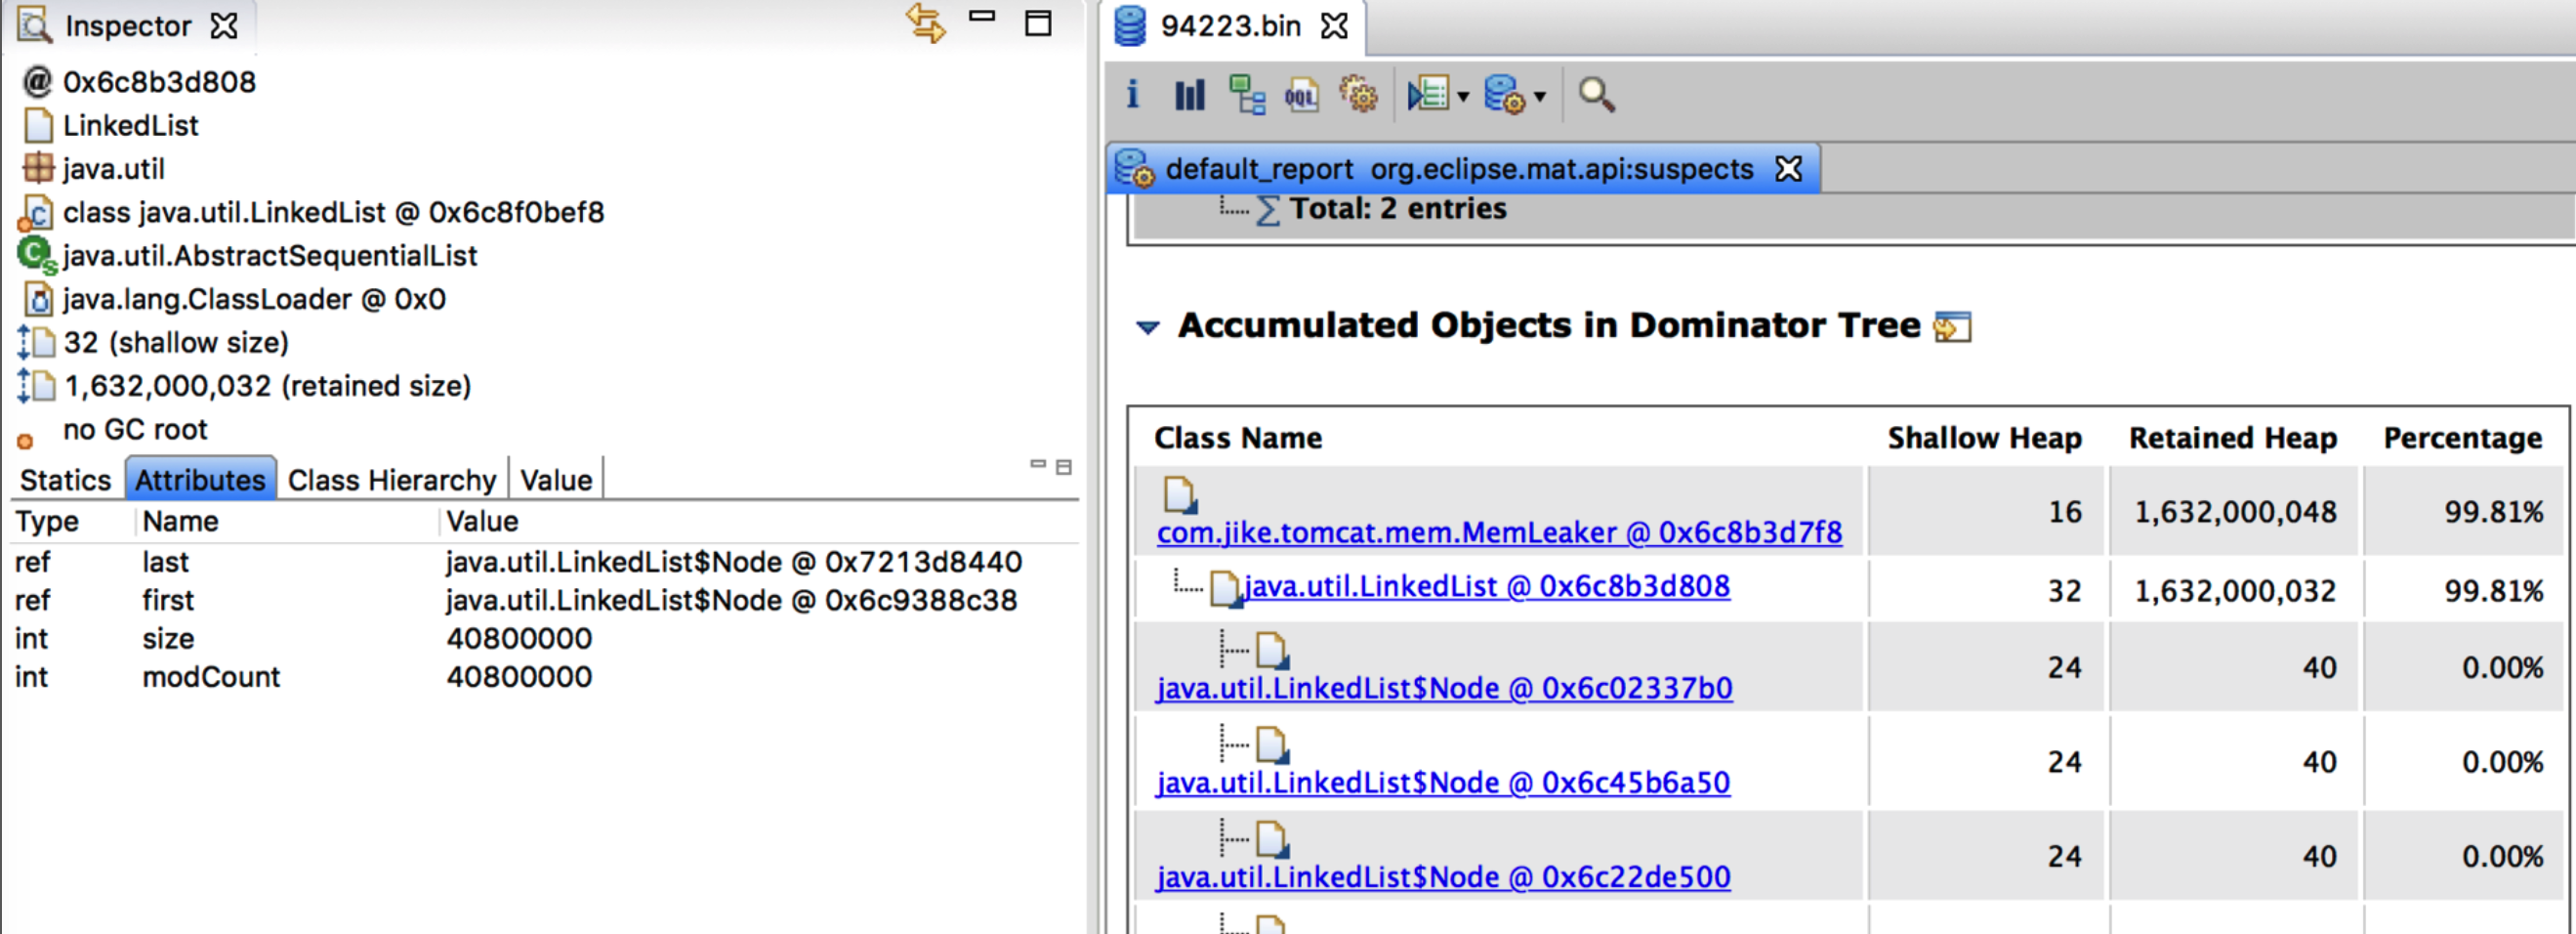
<font style="color:rgb(55, 53, 47);">从报告中可以看到,JVM 内存中有一个长度为 4000 万的 List,至此我们也就找到了泄漏点。</font>